Lutfi Al-Sharif1, Ghazi Al Sukkar2, Mahmoud Mansour1, Mohammad Gharbieh2, Esraa Farraj1, Rawan Jarrah1, Rasha Milekh1, Noor Zaben1
1Mechatronics Engineering Department, University of Jordan, Amman 11942, Jordan
2Electrical Engineering Department, University of Jordan, Amman 11942, Jordan
1Corresponding author: This email address is being protected from spambots. You need JavaScript enabled to view it.
This paper was presented at The 5th Symposium on Lift & Escalator Technology (CIBSE Lifts Group and The University of Northampton) (2015). This web version © Peters Research Ltd 2016
Keywords: elevator; lift; inter-arrival time; inter-service time; round trip time; interval; Poisson arrival process; system loading; calculation; simulation; Monte Carlo simulation.
Abstract
The round trip time has been traditionally found by using calculation methods, either analytically by the use of equations or numerically by the use of Monte Carlo simulation or Markov chains. This paper explores the use of simulation to extract the value of the round trip time. The main reasons for the difference between the value of the round trip time under calculation and simulation are the three random effects: the randomness of passenger destinations (thus making the value of the round trip time a random variable), the randomness of the passenger arrival (driven by a Poisson passenger arrival model) and the effect of bunching (thus making the value of the interval a random variable). The value of the round trip time has been plotted against the system loading level for the case of a single entrance and incoming traffic only. The system loading level has been varied from values as low as 0.05 (i.e., 5%) up to an overloaded system level of 3 (i.e., 300%). Different conditions have been simulated including constant and random passenger arrivals, as well as queues allowed and queues not allowed conditions. Varying these conditions provides an essential insight into the variation of the round trip time and the reasons for it.
Nomenclature and Acronyms
AR% is the passenger arrival rate expressed as the building population in five minutes
CC is the rated car capacity in passengers
FIFO first in first out (of a queue) the passenger arrival rate in passengers per second
 the design passenger arrival rate in passengers per second according to which the system was originally designed
 the actual passenger arrival rate in passengers per second to which the system is exposed
L is the number of the elevators in the group
ρ the system loading (where 1 denotes 100% system loading)
RTT or T is the average value of the round trip time in seconds during the total simulation time and averaged over a large number of trials
 the value of the round trip time in seconds (as a random variable varying from each round trip to the next)
WS is the nominal simulation time referred to as the workspace in seconds
1 Introduction
The round trip time has been, and still is, the basic tool for designing elevator traffic systems. It has been customary to evaluate the value of the round trip time using calculation or the Monte Carlo simulation method.
A previous paper has outlined six methods for deriving the round trip time [1]. The first five of these are analytical ([2]-[9]) and numerical ([10], [11], [12] and [23]). Numerical methods have also been used to calculate the value of the average travelling time (e.g., using the Monte Carlo simulation method to evaluate the value of the average travelling time [13]). The sixth presented method was based on simulation, although few details were given. This paper outlines a possible methodology for extracting the round trip time from the simulation data.
Queuing theory has been used in order to try to understand the performance of the elevator traffic systems under simulation [14]. Classical queuing theory can be used to estimate the value of some critical parameters such as the average waiting time and the average queue length.
Section 2 presents a qualitative explanation for the reasons of the discrepancy between the values of the round trip time under calculation and simulation. Section 3 provides an overview of the MATLAB code used to run the simulation. Section 4 discusses results for a 12 floor building and shows the variation of the round trip time under increasing system loading. The results from section 4 are discussed in section 5. Conclusions are drawn in section 6.
2 The Cause of the Discrepancy
In theory, the value of the round trip time found by calculation should be identical to the value found in simulation. However, it is generally acknowledged that the value of the round trip time under simulation is smaller than that resulting from calculation. Differences between calculation and simulation are discussed in [15].
The main reason for this discrepancy is the fact that the number of passengers boarding the elevator car on average is smaller than that assumed under calculation. It is in fact the random effects that arise under simulation that lead to a smaller number of passengers boarding the elevator car under simulation and thus causing a difference between the two values of the round trip time.
The combination of the restriction in the car size coupled with random effects (detailed later in this section) are the reason why the average number of passengers boarding the elevator car is smaller than that expected under calculation. This is explained as follows:
- In cases where the number of passengers waiting to board the elevator is larger than the car capacity (CC), only CC passengers can board the elevator car (assuming 100% car loading is possible). The remaining passengers remaining will be added to the queue in order to board a future elevator car under real life simulation (or discarded under the hypothetical no queuing simulation introduced later in this paper).
- In cases where the number of passengers waiting to board the elevator is smaller than the car capacity, the elevator car will collect them and depart (and will not wait for further passengers to arrive in order to fill the elevator car up). This point is what leads to the smaller car loading on average, and thus to a reduction in the value of the round trip time.
The net effect of these two last points is that the effective number of passengers boarding the elevator car in each round trip is smaller than the car capacity (CC). There are five sources of randomness, listed below:
- The randomness of the passenger destinations: In each round trip the passengers boarding the elevator car will select different destinations. These random destinations depend on the relative floor populations. The fact that they are different in each round trip results in different values of the round trip time in each trip. The consequences of this variability in the value of the round trip time are that the elevator car will spend different times away from the main entrance. When the elevator car returns to pick up passengers from the main entrance, the number of passenger waiting to board the elevator car will be proportional to the value of the last round trip time.
- The randomness of the passenger arrival process: It has been shown that the passenger arrival process in elevators is a random process, whereby the number of passengers arriving in a specified period of time follows a Poisson probability density function. The consequences of these random passenger arrivals are that a different number of passengers will be waiting to board the elevator when it returns to the main entrance (regardless of the variability in the value of the round trip time itself).
- The variability in the value of the interval (caused by the phenomenon of bunching): Even if it were possible to prevent the variability in the value of the round trip time, the value of the actual interval could vary. This is due to the phenomenon of bunching ([16], [17]), whereby the elevators are not equally spaced in their movements. Bunching leads to variability in the actual value of the interval. The interval is in effect the time during which the passengers that will board the next elevator car accumulate. If the interval is longer than the average value, more passengers will arrive; if it is shorter, fewer passengers will arrive.
- Edge effects: When the workspace (WS) of the simulation is relatively short (e.g., 300 s) the effect of the first and last journeys can be significant. The elevator car for the last journey of the simulation would usually be carrying the remaining passengers, the number of which would be smaller than CC. The first journey could also involve a larger than normal or smaller than normal number of passengers and hence could distort the overall results.
- The initial conditions: The initial position of the L elevator cars can also have a significant effect on the value of the round trip time.
It is relatively easy to overcome the last two sources of randomness. Edge effects can be overcome by removing the first and last journey and increasing the value of the workspace. The initial conditions are overcome, by carefully locating the position of the elevator cars in the round trip cycle such that they are perfectly spaced.
It is worth noting that the effect of the group control algorithm is beyond the scope of this paper. Work has been done in order to amend the formulae for the round trip time to take the effect of the elevator group controller into consideration in [18], [19] and [20].
3 Material and Methodology
In order to extract the value of the round trip time from simulation, a simple MATLAB code was written that can simulate a group of elevator cars under incoming traffic conditions and single entrance. Various software switches can be used to simulate different conditions in order to better understand the effect of different conditions, assumptions and settings. The software runs the simulation for the workspace time (WS).
It is based on incoming traffic only from a single entrance. The software contains two parts: a calculation part that carries out the design of the elevator traffic system using the HARint Plane methodology ([21], [22]); and a simulation part that receives the parameters of the elevator traffic system design from the calculation part and carries out the simulation for a specified period of workspace (WS). The simulation produces graphical outputs as well as spreadsheet data for the following parameters:
- Average passenger waiting time.
- Average passenger travelling time.
- Average passenger queue length.
- Average value of the round trip time.
- Average car loading.
The following rules are followed in running the software:
- The set of passengers are generated at the start of the simulation for the whole period of the workspace (assuming constant passenger arrivals or Poisson passenger arrivals).
- The car capacity is set to exactly the number of passengers stipulated by the calculation (an integer value is used). Hence, 100% car loading is allowable.
- When the elevator car returns to the main entrance, it picks up as many passengers as are present, but no more than the maximum number of passengers.
- The elevator will not wait for more passengers to fill up with the maximum number of passengers.
- Any passengers arriving while the existing passengers are boarding are also allowed to board.
- Any passengers arriving after the doors start closing cannot board the elevator and will have to wait for the next elevator to arrive (thus joining the queue).
- No door re-openings are allowed.
- Any passengers that cannot board the elevator will remain in the lobby in a queue (or discarded if the switch for no-queuing allowed is active).
- If there are no passengers present in the lobby when the elevator arrives then the elevator will not leave and will stay at the lobby with its doors open.
- For the purposes of extracting the round trip time from the simulation, the idle time has to be removed. So if there are no passengers in the lobby, this time does not count as part of the round trip time.
- In order to remove edge effects, the first and last round trips are excluded from the calculations of the round trip and the average number of passengers boarding the car. The software automatically finds the start and end points of each round trip (e.g., by looking for the door-start-of-closing-point in time and using it as a reference). Once all the round trips have been identified, the values of the first and last trip are excluded from calculating the average value.
4 Sample Results
A numerical example is presented in this section. It illustrates the points introduced earlier in this paper. A sample building is used in order to plot the value of the round trip time against system loading. The system loading is varied in increments of 0.05 starting from the value of 0.05 (i.e., 5%) loading up to 300%.
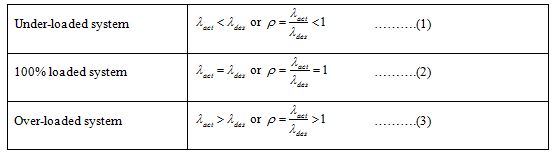
System loading is varied by varying the actual value of the arrival rate (in passenger per second) () against the design arrival rate (in passengers per second) denoted as (). Thus a system loading of 100% is represented by passengers arriving at the rate that was anticipated in the original design; an under-loaded system will experience passengers arriving at a rate smaller than the design arrival rate; and an overloaded system will experience passengers arriving at a rate larger than the design arrival rate. This is summarised in Table 1 below.
Table 1: Summary of the three loading conditions.
Effectively, varying the value of is a change in the value of the arrival rate AR%.
Numerical Example
A building has 12 floors above the main entrance. The total building population is 1000 persons. The floor by floor population and the floor heights are shown in Table 2.
Table 2: The floor populations and the floor heights of the building.
| Floor | Floor popluation (persons) | Floor height (m) | Type of floor (Ent, Occ) |
| 12th | 25 | N/A | Occupant |
| 11th | 25 | 4 | Occupant |
| 10th | 25 | 4 | Occupant |
| 9th | 25 | 4 | Occupant |
| 8th | 50 | 6 | Occupant |
| 7th | 75 | 6 | Occupant |
| 6th | 100 | 6 | Occupant |
| 5th | 100 | 6 | Occupant |
| 4th | 125 | 6 | Occupant |
| 3rd | 125 | 8 | Occupant |
| 2nd | 150 | 8 | Occupant |
| 1st | 175 | 8 | Occupant |
| Ground | N/A | 10 | Entrance/Exit |
Other parameters are shown below:
Kinematic parameters:
Rated speed: 3.15 m/s.
Rated acceleration: 1 m/s2.
Rated jerk: 1 m/s3.
Passenger data
Passenger transfer into the elevator car: 1.2 s
Passenger transfer out of the elevator car: 1.2 s
Door timing data
Door opening time: 2 s
Door closing time: 3 s
The user requirements are:
Arrival rate: 12% of the building population arriving in five minutes.
Target interval: 30 s
A design for the elevator traffic system for the building is carried out using the Monte Carlo simulation method for finding the value of the round trip time and HARint plane for the design methodology ([21], [22]). The resulting value of the number of passengers boarding the car is not an integer in this design. It is not possible to compare this calculation with simulation. It is thus necessary to round up the number of passengers to the nearest integer, which is equal to 12 passengers in this case. The user requirements have to be revised to suit this such that 12 passengers boarding the car represents a system loading of 100%.
The final design that has been used (which is based on an integer value for the number of passengers) is listed below:
- Number of elevators in the group (L): 5 elevators
- Number of passengers: 12 passengers (thus this is set as the car capacity with 100% car loading allowable).
- Speed: 3.15 m/s.
- Round trip time: 143.381 s
- Actual interval: 28.68 s
- Nominal arrival rate in passengers per second (λ): 0.4 passengers/second
- Adjusted arrival rate in passengers per second (following the adjustment of the number of passengers to an integer number): (λ): 0.418 passengers/second
The value of the round trip time has been plotted against the system loading in Figure 1, for a value of workspace equal to 300 seconds. The value of the round trip time has been normalised in the figure by dividing the absolute values by the maximum value of the round trip time (143.381 s) that attains this maximum value when 12 passengers board the elevator car (which is the maximum allowable car capacity).
It is worth noting that the round trip time does not exceed the nominal calculated value of the round trip time that is attained when the car is full even under high system loading conditions. This can be seen in the saturation effect Figure 1 and can be explained as follows. As the system loading increases, more passengers arrive that can be taken by the available elevators. The passengers who cannot board the elevators will join a queue. As the system loading increases, the queue becomes even longer. The number of passengers who can board each elevator is limited to the rated capacity (CC) (assuming that 100% loading is allowed and possible). As the queue becomes excessively long, each elevator car becomes very likely to find a sufficient number of passengers to board it and to fill it up as soon as it arrives in the lobby. Thus the round trip time attains its maximum possible value expected in the design stage, but no more.
The round trip time has been plotted for a number of different conditions listed below. It is accepted that under these conditions the value of the round trip time has become a random variable (), and it is in fact the average value of this random variable that is quoted (![]() ) denoted as RTT or T.
) denoted as RTT or T.
- Queuing allowed under constant arrival conditions and Poisson passenger arrival conditions: Under these conditions, passengers who arrive join a first-in-first-out queue (FIFO). When the car is available for boarding, passengers leave the queue one at a time and board the car. Once the car is full, passengers who have not boarded remain in the FIFO queue. As can be seen from the figure there is little difference between the constant arrival process and the Poisson arrival process. The reason is that queuing has been allowed, and this effectively decouples the average number of passengers boarding the elevator car from the arrival process. It is also worth noting that the value of the round trip time at a system loading of 100% (i.e., ρ=1) denoted as point C1, C2 is smaller than the maximum possible value for the round trip.
- Queuing not allowed under constant arrival conditions: In this case, passengers who are prevented from boarding the car because it is already full are not added to the FIFO queue, but are discarded (this is an example of the hypothetical conditions that are used in this paper). This is referred to as the case of “no queuing allowed”. It is acknowledged that this condition will not take place in real life. It is shown here as it is easy to calculate using analytical equations or the Monte Carlo simulation method, and can provide a lower analytical bound on the actual value of the round trip time. It is denoted as point E in the Figure 1, where its value is smaller than the value of the round trip time under queuing conditions at a system loading of 100%.
- Queuing not allowed under Poisson arrival conditions: In this case, passengers who are prevented from boarding the car because it is already fully are discarded. Passengers arrive under Poisson arrival conditions and this introduces a new source of randomness further reducing the effective car load and thus the value of the round trip time. At a system loading of 100% (ρ=1), the value of the round trip time under these conditions is denoted by the point F in Figure 1.
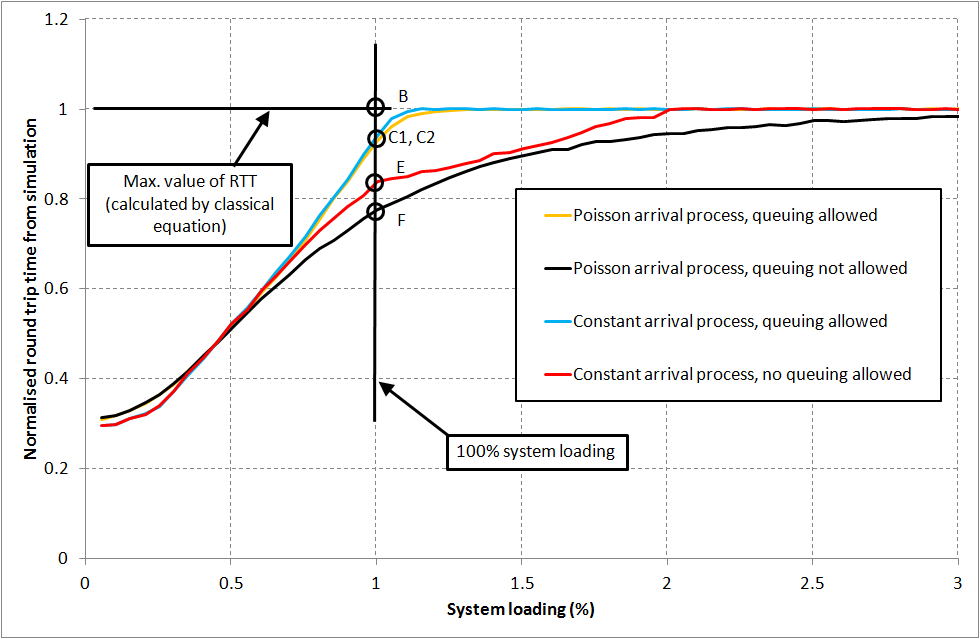
Figure 1: The normalised value of the round trip time against system loading under different conditions (the value of the workspace is 300 seconds).
The effect of the value of the workspace has been investigated and the results are shown in Figure 2. The round trip time under simulation conditions has been plotted against system loading for three values of workspace: 300 s, 600 s and 900 s. The passenger arrival model has been assumed to follow a Poisson process. From the figure the following two conclusions can be drawn:
- Under the condition of queuing allowed the value of the workspace has virtually no effect.
- Under the condition of “no queuing allowed” the increase in the value of the workspace forces the values of the round trip time to settle down to the lower bound. The explanation for this is that the larger the workspace, the more random edge effects and transient behaviour are diminished and become less pronounced.
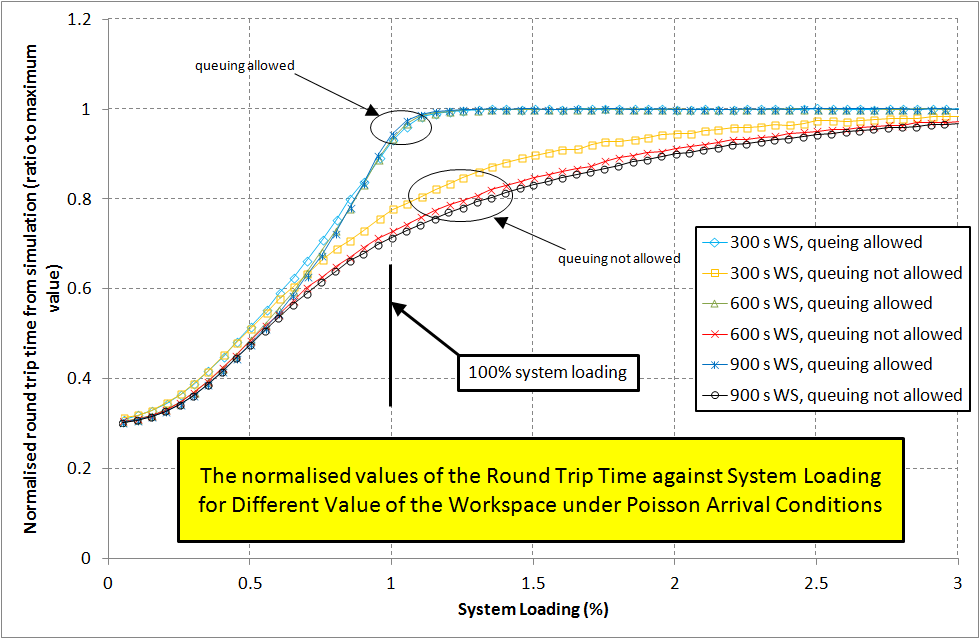
Figure 2: The normalised values of the round trip time against system loading for different workspaces.
5 Discussion
As seen in the last section and in Figure 1 the value of the round trip is different between calculation and simulation at a system loading of 100% (ρ=1). There are a number of factors that affect this final value of the round trip time. It is possible to think of the value of the round trip time as starting from the value found in calculation and then being transformed by a number of effects into the final value under simulation, as follows:
- The round trip time value under calculation is based on the value of the number of passengers boarding the elevator car in each trip and vice versa (point B in Figure 1). It is worth noting that this value is based on a number of assumptions:
a. The value of the round trip time is a constant (T) rather than a random variable.
b. The passenger arrival process is constant, with a constant inter-arrival time.
c. The value of the round trip time is constant and does not vary as the passenger destinations vary.
d. There is no bunching.
e. With the ideal conditions above, no queues will ever develop and hence queuing in effect is irrelevant. - When the random effects of bunching and the randomness of the passenger destinations are taken into consideration and no queuing is allowed, the value of the round trip time drops to the value shown on point E in Figure 1. In this case, passengers who are unable to board the full elevator cars are discarded. Bunching is caused by the random destinations of passengers, as these lead to variations in the values of the round trip times of the different elevators.
- When the random effects of the passenger arrival process (Poisson process) are added, this leads to further randomness in the value of the round trip time, which in turn leads to a reduction in the number of passengers boarding the elevator car in each trip, and thus to a reduction in the value of the round trip time (shown as point F in Figure 1). As in the previous point, the value of the round trip time is a random variable and no queuing is allowed.
- Finally, once the effect of queuing is added, the value of the round trip time rises back to a value shown as point C1/C2 in Figure 1 which is the actual value of the round trip time expected under simulation. This value is still smaller than that given by the initial calculation shown as point B in Figure 1.
This discussion has elucidated how the different effects under simulation gradually change the value the round trip time from that found in calculation to that achieved under simulation at a system loading of 100% (ρ=1).
6 Conclusions
There has long been an acceptance among vertical transportation system designers that a discrepancy exists between the value of the round trip time evaluated by calculation and that extracted from simulation. The main reason for this discrepancy is the lower average value of the number of passengers boarding the elevator car in each trip in simulation compared to the value assumed in calculation.
It suggested that the reason for this lower value of the number of passengers than expected is the combination of the restricted car size and the random effects. There are five random effects: the randomness of the passenger destinations (that lead to variable values of the round trip times); the randomness of the passenger arrival process (assumed to follow a Poisson probability density function for the number of passengers arriving in a period of time); the variability of the value of the interval caused by the bunching phenomenon; the edge effects (at the start and the end of the simulation); and the assumed initial conditions regarding the phases of the elevators in the group. In addition, the presence of a FIFO queue of the arriving passengers and those who are unable to board full elevator cars has a very strong effect on the final value of the round trip time (as it can potentially lead to a plentiful supply of passengers in the lobby and completely decouple the value of the round trip time from the passenger arrival process).
Hypothetical scenarios have been run in simulation (e.g., no-queuing allowed scenario). While it is acknowledged that such scenarios will not take place in real life, they are very insightful in presenting a qualitative explanation and aiding the understanding of the underlying mechanics of the elevator traffic system during simulation.
The value of the round trip time has been plotted against system loading under simulation for different conditions. The effect of queuing is analysed by plotting the value of the round trip when queuing is allowed for passengers unable to board a full elevator, and when queuing is not allowed (where passenger unable to board a full elevator are discarded). A comparison is also made between constant arrival conditions (where the inter-arrival time between successive passengers is constant) and random arrival conditions (where the inter-arrival time between successive passenger arrivals is random) following a Poisson arrival process. The values of the round trip time extracted from simulation at a system loading of 100% are found to be smaller than the maximum value of the round trip time evaluated by calculation assuming a full car. It is also shown that the value of the round trip time under constant arrival conditions and no queuing allowed is larger than the value of the round trip time under Poisson arrival conditions and assuming that no queuing is allowed.
Finally, the effect of the workspace has been investigated. It is shown that under queuing allowed conditions, the workspace length has no effect on the value of the round trip time. Under no queuing conditions, the increase in the value of the workspace allows the value of the round trip time to settle to its steady state value, due to the fact that edge effects and transient effects are diminished by the longer workspace.
The results shown above are insightful in understanding the random nature of simulation and can have practical effects in the process of designing vertical transportation system and sizing its components.
REFERENCES
- Lutfi Al-Sharif, Ahmad M Abu Alqumsan, Ahmad T Hammoudeh, “Analytical, Numerical and Simulation: Six Methods for Evaluating the Elevator Round Trip Time”, proceeding of Elevcon 2014, Paris, France, July 2014, vol 20, pp 62-73.
- CIBSE, “CIBSE Guide D: Transportation systems in buildings”, published by the Chartered Institute of Building Services Engineers, Fourth Edition, 2010.
- G. C. Barney, “Elevator Traffic Handbook: Theory and Practice”, Spon Press/Taylor & Francis, London and New York, ISBN 0-415-27476-1, 2003.
- Lutfi Al-Sharif, “The effect of multiple entrances on the elevator round trip time under up-peak traffic”, Mathematical and Computer Modelling, Volume 52, Issues 3-4, August 2010, pp 545-555.
- Lutfi Al-Sharif, Ahmad M. Abu Alqumsan, Rasha Khaleel, “Derivation of a Universal Elevator Round Trip Time Formula under Incoming Traffic”, Building Services Engineering Research & Technology, March 2014 vol. 35 no. 2 pp 198-213, doi:10.1177/0143624413481685.
- N.R. Roschier, M.J., Kaakinen, "New formulae for elevator round trip time calculations", Elevator World supplement, 1978.
- Richard D. Peters, “Lift traffic analysis: Formulae for the general case”, Building Services Engineering Research & Technology, vol. 11, no. 2, 1990, pp 65-67.
- Lutfi Al-Sharif and Ahmad M Abu Alqumsan, “Stepwise derivation and verification of a universal elevator round trip time formula for general traffic conditions”, Building Services Engineering Research & Technology, published online before print, 9th July 2014, doi: 10.1177/0143624414542111, May 2015 vol. 36 no. 3, pp 311-330.
- Lutfi Al-Sharif, Ahmad M. Abu Alqumsan, Rasha Khaleel, “Derivation of a Universal Elevator Round Trip Time Formula under Incoming Traffic”, BUILDING SERV ENG RES TECHNOL, March 2014 vol. 35 no. 2 pp 198-213, doi:10.1177/0143624413481685.
- Haneen Raid Abu Al-Hayja’a, Maisa’a Omar Younes, “The Direct use of Markov Chains to Evaluate the Elevator Round Trip Time under Incoming Traffic and Multiple Entrances”, Supervisor: Lutfi Al-Sharif, Final Year Project, Mechatronics Engineering Department, The University of Jordan, 2012/2013.
- Lutfi Al-Sharif, Hasan Shaban Algzawi, Ahmad Tayseer Hammodeh, “The Use of the Markov Chain Monte Carlo Method in Deriving the Elevator Round Trip Time under Incoming Traffic Conditions and a Single Entrance”, AMO – Advanced Modeling and Optimization, Volume 15, Number 3, 2013, pp 689-695.
- Lutfi Al-Sharif, Ahmad Hammoudeh, “Evaluating the Elevator Round Trip Time for Multiple Entrances and Incoming Traffic Conditions using Markov Chain Monte Carlo”, International Journal of Industrial and Systems Engineering (IJISE), Inderscience Publishers, 2014 Vol.18, No.1, pp.51 - 64.
- Lutfi Al-Sharif, Osama F. Abdel Aal, Ahmad M. Abu Alqumsan, “Evaluating the Elevator Passenger Average Travelling Time under Incoming Traffic Conditions using Analytical Formulae and the Monte Carlo Method”, Elevator World, June 2013, pp 110-123.
- Lutfi Al-Sharif, Ahmad Abu Alqumsan, Weam Ghanem, Islam Tayeh, Areej Jarrar, “Modelling of Elevator Traffic Systems Using Queuing Theory”, Symposium on Lift and Escalator Technologies, The University of Northampton, Northampton, United Kingdom, September 2014, volume 4, pp 9-18.
- Lutfi Al-Sharif and Mohamed D. Al-Adhem, “The current practice of lift traffic design using calculation and simulation”, BUILDING SERV ENG RES TECHNOL July 2014 vol. 35 no. 4, pp 438-445, published online 26 September 2013, doi: 10.1177/0143624413504422.
- Lutfi Al-Sharif, “Bunching in lifts: Why does bunching in lifts increase waiting time?” Elevator World, 1996, number 11, pp 75–77.
- Lutfi Al-Sharif, Bunching in Lift Systems, In Elevator Technology 5, the proceedings of the 5th International Congress on Elevator Technologies, Elevcon '93, Vienna, Austria, 1993, volume 5.
- G.C. Barney, “Uppeak revisited”, in Elevator Technology 4, International Association of Elevator Engineers, Proceedings of Elevcon ’92, Amsterdam, The Netherlands, May 1992, pp 39-47.
- G.C. Barney, “Uppeak, down peak and interfloor performance revisited”, in Elevator Technology 9, Proceedings of Elevcon ’98, Zurich, Switzerland, published by the International Association of Elevator Engineers, pp 31-40.
- Lutfi Al-Sharif, Jamal Hamdan, Mohamed Hussein, Zaid Jaber, Moh’d Malak, Anas Riyal, Mohammad AlShawabkeh, Daoud Tuffaha, “Establishing the Upper Performance Limit of Destination Elevator Group Control Using Idealised Optimal Benchmarks”, Building Services Engineering Research & Technology, published online before print 13th January 2015, doi: 10.1177/0143624414566996.
- Lutfi Al-Sharif, Ahmad M. Abu Alqumsan, Osama F. Abdel Aal, “Automated optimal design methodology of elevator systems using rules and graphical methods (the HARint plane)”, Building Services Engineering Research & Technology, August 2013 vol. 34 no. 3, pp 275-293, doi: 10.1177/0143624412441615.
- Lutfi Al-Sharif , Osama F. Abdel Aal, Ahmad M. Abu Alqumsan, Mohammad A. Abuzayyad, “The HARint Space: A Methodology for Compliant Elevator Traffic Designs”, Building Services Engineering Research & Technology, January 2015, vol. 36, no. 1, pp 34-50, published online June 20, 2014, doi: 0143624414539968.
- Lutfi Al-Sharif, Hussam Dahyat, Laith Al-Kurdi, “ The use of Monte Carlo Simulation in the calculation of the elevator round trip time under up-peak conditions”, Building Services Engineering Research and Technology, volume 33, issue 3 (2012) pp. 319–338, doi:10.1177/0143624411414837.
BIOGRAPHICAL DETAILS
Lutfi Al-Sharif received his Ph.D. in lift traffic analysis in 1992 from the University of Manchester. He worked for 9 years for London Underground, London, United Kingdom in the area of lifts and escalators. In 2002, he formed Al-Sharif VTC Ltd, a vertical transportation consultancy based in London, United Kingdom. He has 17 published papers in peer reviewed journals the area of vertical transportation systems and is co-inventor of four patents. He is currently Associate Professor in the Department of Mechatronic Engineering at The University of Jordan, Amman, Jordan.